The Reality of Retirement
What if I told you that you’re probably planning to enjoy retirement for only 13 years? That’s right!
here’s a crazy fact: the average American retires at 64 and only lives until 77. That’s just 13 years of retirement!
Most people think about retiring in their 60s. But you have to realize That’s also the time when Social Security and Medicare start to kick in.
Let’s imagine a world where retiring in your 60s isn’t the norm. If we look at our life on a timeline, does it make sense to stop working so late and have so little time to enjoy it?
In this post, we’ll break down How To Retire Early With All the calculations you will need, (for any given income level) Our goal will be to create a roadmap for To reach retirement ASAP. So We have more time to do the things we love- traveling, spending time with family, or pursuing hobbies. whatever brings a smile to our faces!
What is Retirement?
In our society, retirement isn’t about how smart you are, how hard you work, or how many years you’ve worked. It’s all about one thing: money. You can call it wealth or assets, but the main idea is the same. We need enough money to pay for the rest of our life without working.
But remember, while money is the key. Retirement is really about freedom. It’s about choosing how you spend your time without worrying about a paycheck.
How much Money is enough? That’s different for everyone. Your friends, family, or people on the internet might have opinions. But in reality, it comes down to two things:
- How much you earn + how much you spend for your lifestyle annually.
- Saving = How early you want to retire + how long you want your money to last!
So this equation kind of thing is what we need to figure out and we will have our retirement plan ready!
In this context, I’m not going to talk about how to increase your income. Let’s assume “you do you” and are earning a certain amount. and we will touch the spending and saving part so, we can figure out the fastest way for you to retire from your current situation.
Let’s start with how much you spend each year. This is the biggest factor in retiring as quickly as possible.
Understanding Your Spending
How much you spend each year is super important. It helps you figure out how much money you need to retire ASAP. Let’s break it down.
How Much Money Do You Exactly Need to Retire?
Here’s a simple trick: Take how much you spend in a year right now and multiply it by 25. That’s how much you need to save as simply as that,

For example:
- If you spend $50,000 a year, multiply that by 25.
- You get $1,250,000. That’s your “nest egg” – the amount you need to save to retire.
You might ask what is that withdrawal rate of 4% in the image? It’s a retirement rule on which this multiply by 25 concept is based let’s learn about that in detail:
The 4% Rule
There’s something called the 4% rule given by William Bengen a retired financial planning practitioner according to the rule you can spend a total of 4% of your total savings each year in retirement. And you will not need to earn a penny if you remain with that 4% withdrawal rate annually for up to 25-30 years!
For example: supposing your annual spending is 40,000$ that means you need to save 40,000x 25 which is 1 million$ and that is your “total amount you need to retire”. From this example this is how the 4% will work in Retirement:
In the first year of retirement, you took out 40k which is your annual expense. Your portfolio will be as shown below:
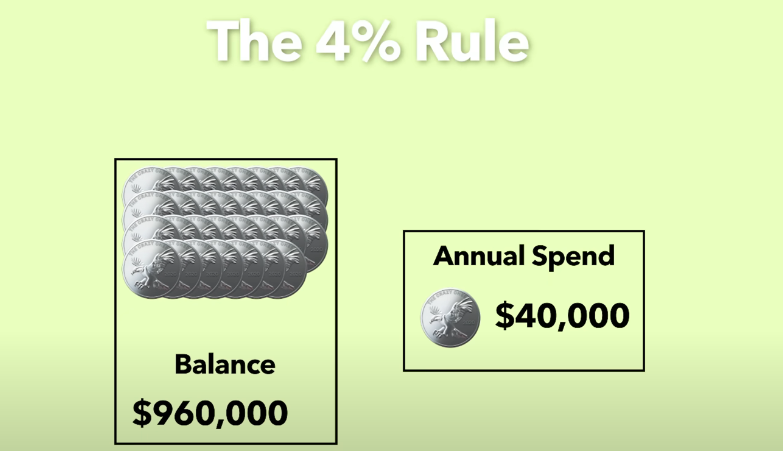
Moving on to year 2: now we have accumulated an 8% return on 960k (how this 8% return? It is because we invested this 1 million We will discuss it just after this example) so, you will have 1,036,800$. And when you take out another 40k you will also take out an additional 800$ more because of 2% inflation which is reported “yearly on average”.
So your final portfolio MONEY AT THE END OF 2ND YEAR WILL BE 1036800- 40800 = 996000$
And then inflation adds up for the third year so as the market returns and “so on and so forth this cycle continues” your investment has 100% surety of lasting till 25-30 years approx. this is an example of a 1million $ saving!
The idea is that your investments will grow enough to cover inflation, taxes, and your spending each year for up to a certain period which he mentioned 30 years but 25 years is the Safest possible case scenario.
Now we will look at how our investment will grow:
Where Will You invest these savings?
Most experts suggest investing in a total stock market index fund. And a bond fund. (and I totally agree with that)
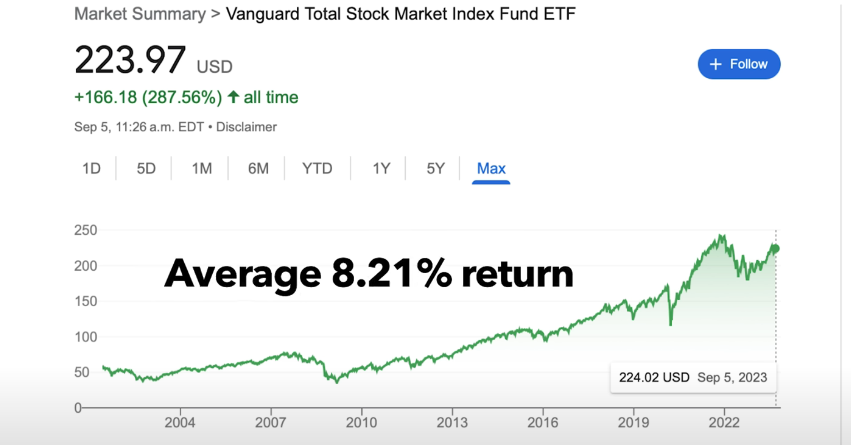
One popular one is called VTSAX or its ETF version, VTI. for stock funds,
and the other one is bond funds a popular one is VBTLX so you have to mix your portfolio in stocks and bonds. For 4% rule it is recommended to do 50/50 or 60/40 in stocks and bonds.
Since 2001, it has grown about 8.21% per year on average. (which I mentioned earlier while explaining the 4% rule)
Remember, your spending is the biggest factor in how much you need to retire. The less you spend, the less you need to save. And that can help you retire sooner!
All these good things around the 4% withdrawal rule are great but it also has a flaw you need to know!
Twist in 4% rule for “Early Retirement”
There is a flaw when we take this 4% Withdrawal rule for someone who needs to retire early.
Quote from David Blanchett-

here’s the Simple thing: how long your money lasts depends on For how long you need it.
For example: If you want to retire early, like in 10 years, and you are 25 or 30 years old. you will need your money to last 40 or 50 years. That’s a long time!
And right here the 4% rule loses its effectiveness.
Just take a pause and have a brief look at the image below it describes the different percentage allocation between bonds and stocks and the years they can last with their success rates of not going 0 and even the best portfolio Split gives us only 20-25 years of 100% surety of not not losing any money! In any given market crash or inflation!
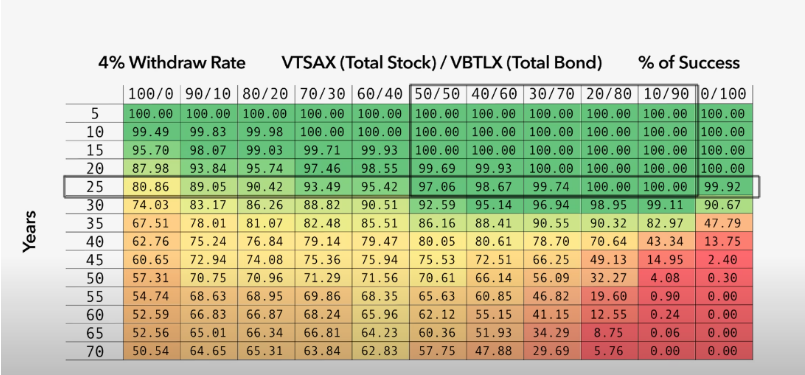
And if you look at the chart once again there is no portfolio Split that provides 100% assurance of you not going out of money at 35 year mark.
NOTE: Please take your time reading this chart carefully we will explain this chart later on as well.
Why this ineffectiveness?
The reason is dead simple With Time your total investment value will fluctuate up and down, but inflation will constantly rise!
So your cost of living will be constantly rising irrespective of your investment going up and down.
For ex: In tough times (like market crashes), you get lesser interest rates and higher inflations.
Due to this, When you withdraw money Your total value of the investment is already less due to the (market crash) and you will need to withdraw more money due to (inflation) in the end making it lesser and lesser in total value.
On the other hand, when the market rises and you get good returns but now “due to the previous market crash”, your total investment value is less so when the market booms you get ROI on the less principal amount.
when we see this condition of market fluctuation paired with a constant rise in inflation, over a bigger time frame which means decades… your investment value will not be enough to bear your lifestyle anymore with a 4% withdrawal rate.
This is why we see a fall in surety % from 100 to lower numbers in the above chart, which shows that after 25 years there is no 100% guarantee of your money to be just enough to bear your expenses with a 4% withdrawal rate.
Other reasons:
- The future is unpredictable. Big events like pandemics or wars can change how well investments do.
- It doesn’t consider taxes, fees, or how spending might change as you get older.
What could be the solution to this?
The answer to all this comes down to:
1. Either you bring down your annual expenses after retirement or make more money and save a hefty amount which will lead to lower percentage withdrawals, like 3% or even 2.5%. To maintain your current lifestyle. This way, you’re more likely to make your money last longer.
2. Or Use the Dynamic strategy by Vanguard. Don’t worry you will get all the details in the savings section that we are going to discuss now,
NOTE: Even with flaws your first goal is to reach total savings that qualify for a 4% withdrawal rate. Only after that, we can think about the two solutions mentioned above. But how would you reach that? Or say How early we can reach that? We are going to discuss those right next,
Savings Part 1 – How Early Can You Retire?
Now in this saving part, our first goal is to reach the 4% mark ASAP then we will talk about how to make our money last longer than those in the 4% RULE. Starting with some basics,
Saving more money has two big benefits:
- You spend less, so you need less money to retire.
- You save more, so you reach your retirement goal faster.
Have you heard of FIRE?

It stands for Financial Independence, Retire Early. It’s a group of people on Reddit trying to retire as fast as they can. Their secret? They save 30%, 50%, or even 70% of their income every year! They live very simply now to have freedom later.
Let’s look at how your savings rate (the percentage of your income you save) affects when you can retire along with some common realistic examples you will love-
I’m going to use these calculators named Networthify and an investment calculator Both do the job and are easy to use.
1. Retiring in 10 years (age 40)
Imagine you’re 30 years old and want to retire by 40. Who doesn’t, right? Let’s say you spend $40,000 a year and have $30,000 saved until now (that’s an average save for Americans under 35). So we will take that saving example here.
To keep spending $40,000 a year in retirement, you’ll need a $1 million nest egg. Using our previous formula of multiplying our spending with *25 which means 40k x 25 = 1 mill.
The next step is to find how much amount we need to save each year which is called “additional contribution” Along with that saving of 30k we currently hold and we need to reach 1 million $.
For that just head to the investment calculator and choose the additional contribution section I marked with a red rectangle see the below image:
Filling up
- Our target: 1 million
- Our starting amount: 30k (current savings we hold)
- Return rate: 8% (which is the average of index funds as mentioned before)
- Compound: annually.
- Contribution setting: at the end of each year.
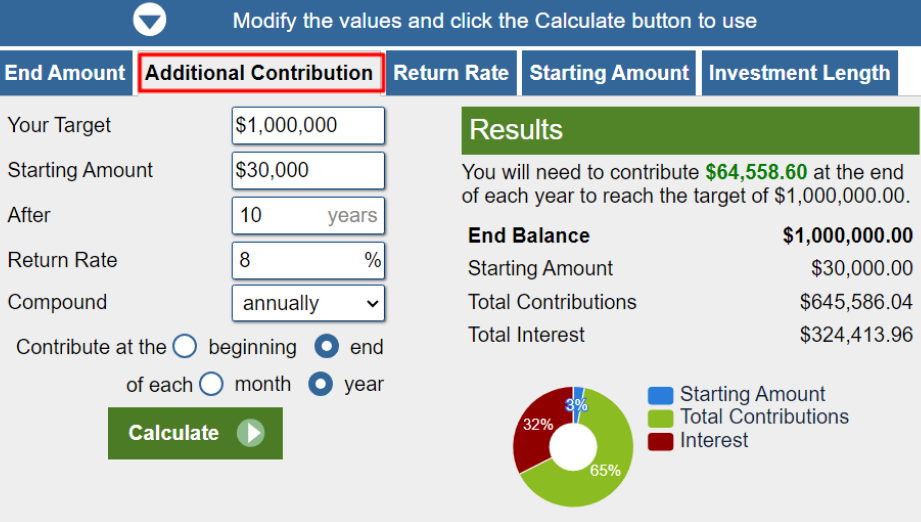
The result showed us we need 64558$ and to keep things simple let’s do 65000$ per year saved to reach 1mill. (if we want to retire in 10 years) That’s damn too much amount🤑🤑!!!
I mean it’s too much as compared to the average American! An average American only saves around 4.5% of their income which is too low and it’s going to take us forever to reach retirement.
So What options do you have?
The first one is to bring down your annual expenses if you do that your target will be less which means less additional contribution each year.
The second one is to increase your retirement year goal from 10 to maybe 12 or 15. which is easier and it will also mean less contribution amount.
Or you can become one of the FIRE groups we discussed above and you can save 60-65% of your income, (just saying).
This calculator is straight to the point, just put the target money, and target year you will get what you need to save each year to reach retirement.
I also want to mention another calculator Networthify Which is more practical and comes with an extra feature to toggle through different saving rates within the dashboard which makes it even more convenient to use, it doesn’t require your target goal of 1 million $, like the previous calculator instead it requires “your after-tax annual income“.
NOTE: I have also discussed various retirement plans with less income and lesser saving rates with networthify.
I assume Every person reading this already knows about their after-tax annual income. If not don’t worry it’s simple math
To calculate Tax I used the tax slab for singles, for more, you can refer to this article by Brilliant Tax later.
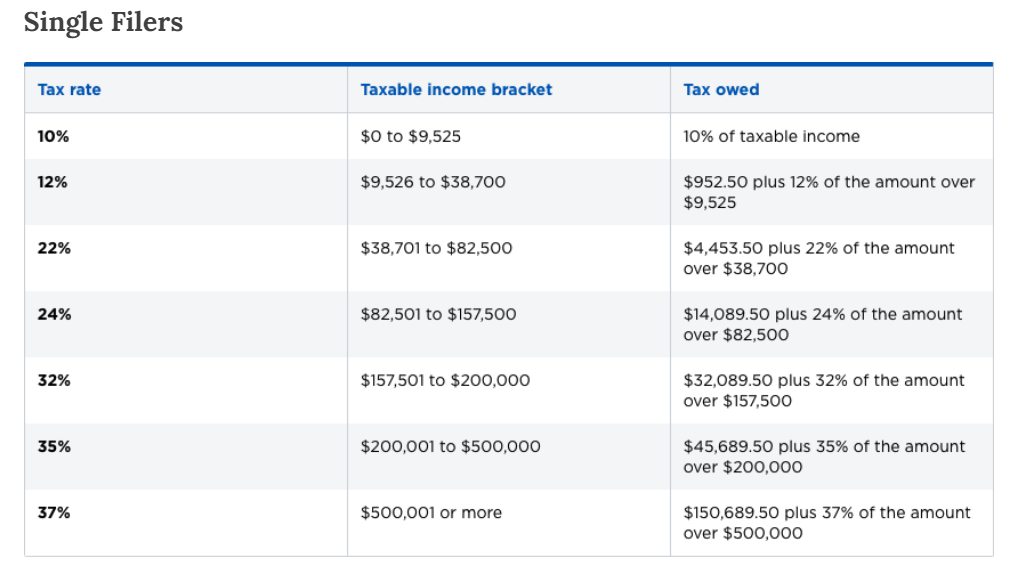
Here is an example of a calculation:

By doing the same With our example of 40k spending and 65k saving “that we calculated with the previous calculator” you will need to Earn at least 105000 $ a year. Simple math right? but here is the twist by tax
In that case, we need to Earn at least $131000 before taxes to have ($105000 after taxes)! According to the calculations, We’d pay about $25,726 in taxes, which is 19.64% of that $131,000. This is the minimum pre-tax income needed to hit our $105,000 post-tax goal. with respect to (the tax slab for singles).
Now if you go to Networthify with the following no’s –
- Total income Post-tax: 105,000$.
- Total expenses- 40,000$
- Current portfolio: our current saving = 30,000$
- Roi: 8%
- Withdrawal: remember we are currently pursuing the 4% rule for now.
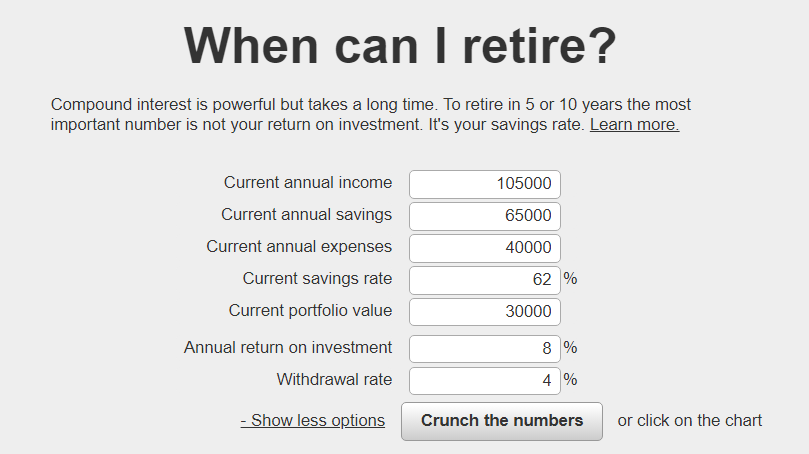
And you see those Current saving rate % and current annual savings in the image above, the calculator will update those numbers automatically once you put those no’s we find in this case it turns out to be 62%
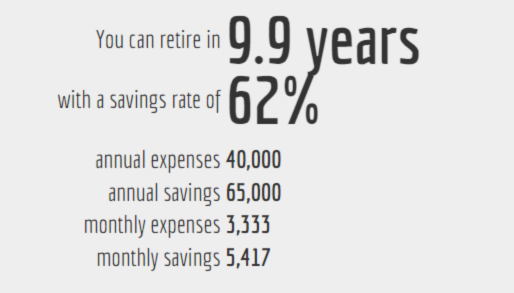
It straight gives you the exact year to reach your retirement. not only that,
Here comes the fav feature: in that calculator, you will see this pillar or rows thing in the middle:

These are savings in percentage. Tap on the pillar representing the % according to what you believe you can save and it will give you an overview like above on how long it will take you to retire with just your post-tax income and your annual spending. easy!!!
And I know when we take the average American this case is not possible, so how about you lengthen your retirement goal to 15 years?
2. Retiring in 15 years (age 45)
If you’re okay waiting 5 more years, even with the same spending of 40k it gets a bit easier. You’d need:
- At least $75,000 after-tax income instead of 105,000 $.
- And a 46% savings rate. (remember to tweak those pillars you see in the middle if you have decided on a different saving rate!)
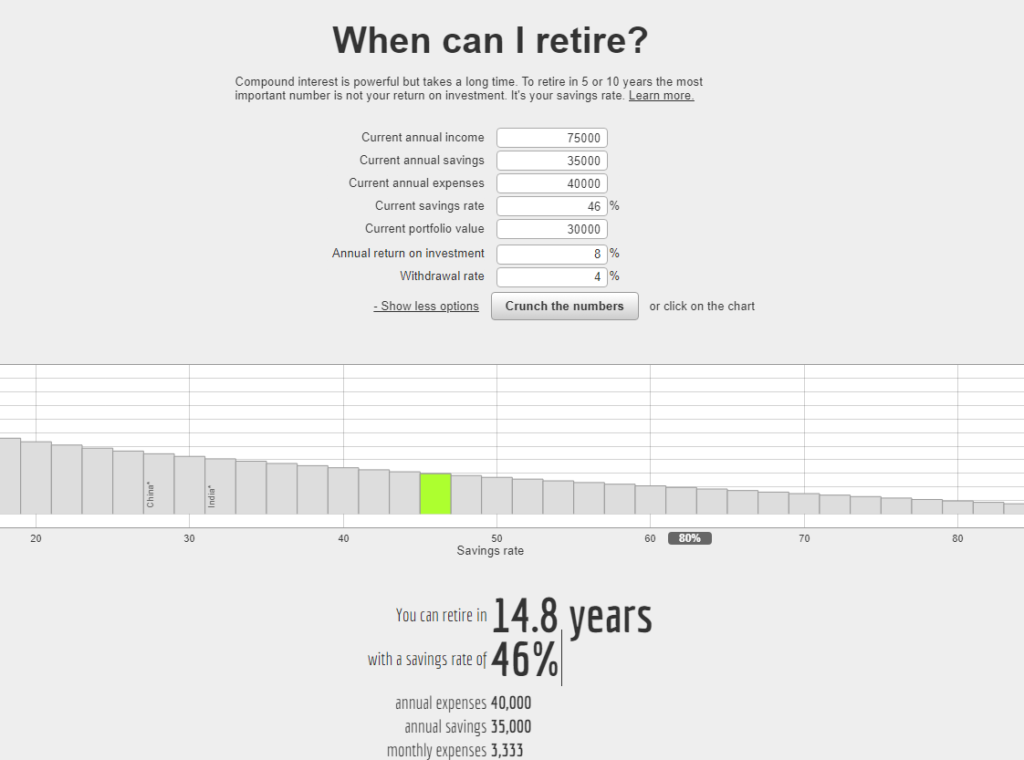
Let’s say saving 46% is still too high which I think will be for most of us so what about 20 years?
3. Retiring in 20 years (age 50)
This is more doable for most people. You’d need:
- At least ($58,000 after taxes) Instead of 75000$
- And a 32% savings rate
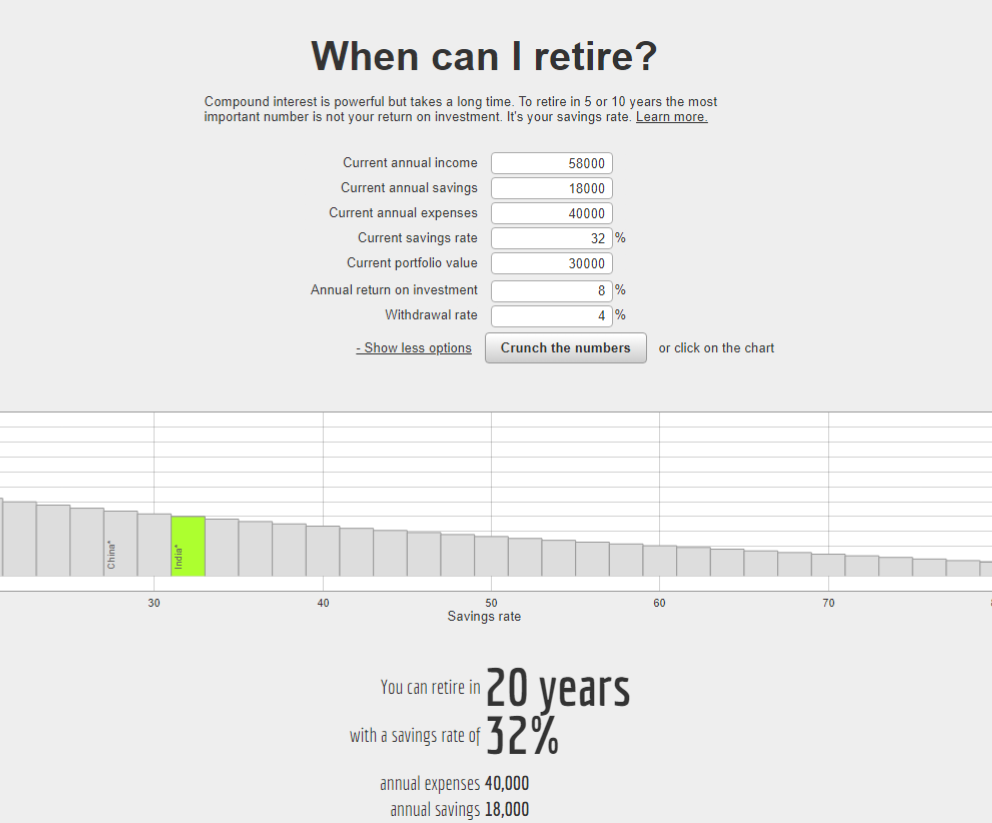
Twenty years might seem long, but it’s much faster than the average American who retires at 65. If you start at 27, you could retire at 47!
Even with different levels of income. The more you save each year, the quicker you reach freedom.
High savings rates might seem hard, but they often mean lifestyle changes. This could be living in a smaller home, driving a less expensive car, or cooking at home more often.
Note: So now you have your retirement numbers- the year, the saving rate, and where to invest, that works for a 4% withdrawal rate, now is the time we talk about going a step forward and making our money last longer for us
Savings part 2 – How Long you want your money to last
As we have already discussed what’s wrong with the 4% rule. “in twist in 4% rule part above”. In this part, we will discuss the chart in a brief, and don’t forget we will also be looking at the solution in detail to make our money last longer!
THE 4% CHART IS BACK-
Once again. This chart is like a map that helps us see how long our money might last based on two things: (portfolio split) and how much we take out each year, (which is 4% here).
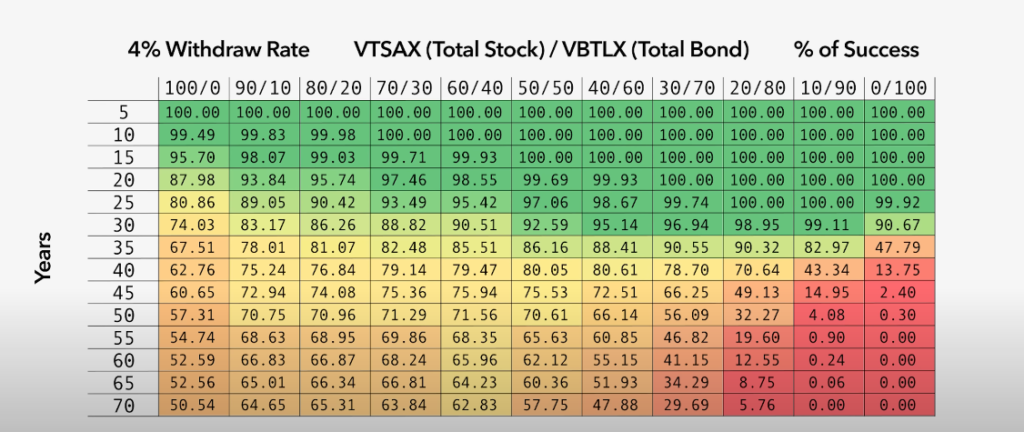
At the top of the chart, we see different ways to split our money between stocks and bonds.

On the far left, it’s all stocks. In the middle, it’s half stocks and half bonds. On the right, it’s all bonds.
The colors in the chart are important:
- Green means your money will likely last the whole time.
- Yellow and orange mean there’s a chance it might not.
- Red means it probably won’t last.
So let us look at the best allocations or portfolio splits with the 4% Withdrawl
- For about 15 years, most ways of investing looked good (lots of green).

For shorter time horizons (up to 15-20 years), most allocations have high success rates.
As the time horizon extends, success rates decline, especially for extreme allocations (100% stocks or 100% bonds).

A 50/50 or 40/60 stock/bond allocation tends to perform well across different time horizons for 25 years!

Now I think you completely understand the chart, The 4% withdrawal rate works great But for longevity, (beyond 25 years) it is pretty questionable.
and the first method to tackle that is not my favorite but still, it is more secure than the 4% if we talk about longer periods.
The 3% Rule – the surety of almost 40 years
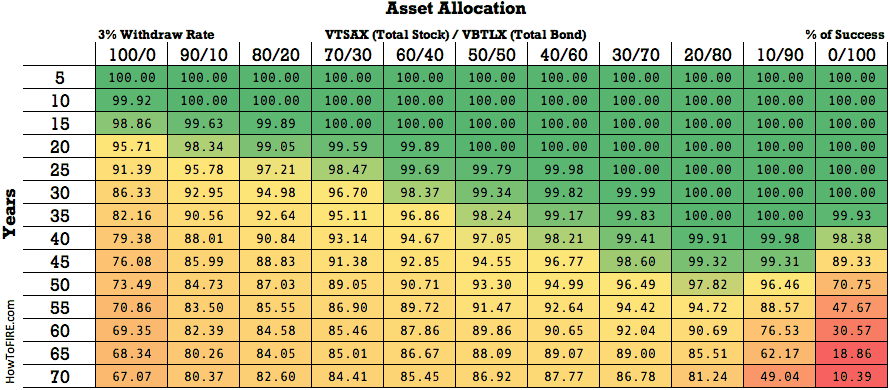
Lower is safer:
- This chart has way more green! That means our money is more likely to last longer if we take out less each year.
The big lesson: If we want to retire early and need our money to last a really long time (like 40 or 50 years), we need to:
Take out less money each year (3 or 3.5% instead of 4%).
I am not a huge fan of this as you will need to save a whole lot more money.
For example, if you spend 40,000$ a year and want a 3% withdrawal rate. The total money you will need will be 40000×100/3 or just multiply it by 33 which will be 1,320,000$.
320,000$ more than you need for 4% or you will need to drastically reduce your annual expense which due to inflation will not be possible in most cases!
But the second method is the one that Believe is a better choice-
The Dynamic Strategy by Vanguard:
Let’s talk about a clever way to make your retirement money last longer. It’s called the dynamic spending strategy. This method is like having a flexible budget that changes based on how well your investments are doing.
How It Works:
- When your investments do well:
- You can spend a little more money that year.
- It’s like giving yourself a small bonus!
- When your investments don’t do so well:
- You spend a little less that year.
- It’s like tightening your belt just a bit.
- You follow a cash reserve option in another high-yielding Saving account
- We keep reserve for up to 2 years of our expense max
- So when the market is seeing a heavy downfall you do not have to withdraw from your investment and instead give it time to recover

Why is this smart?
- By spending less in bad years, you leave more money in your investments.
- When the market gets better, you have more money to grow.
- This helps your money last longer overall.
Let’s look at an example:
Imagine you have $1,000,000 saved for retirement. You plan to use the 4% rule, which means you’d normally take out $40,000 each year.
But with the dynamic strategy:
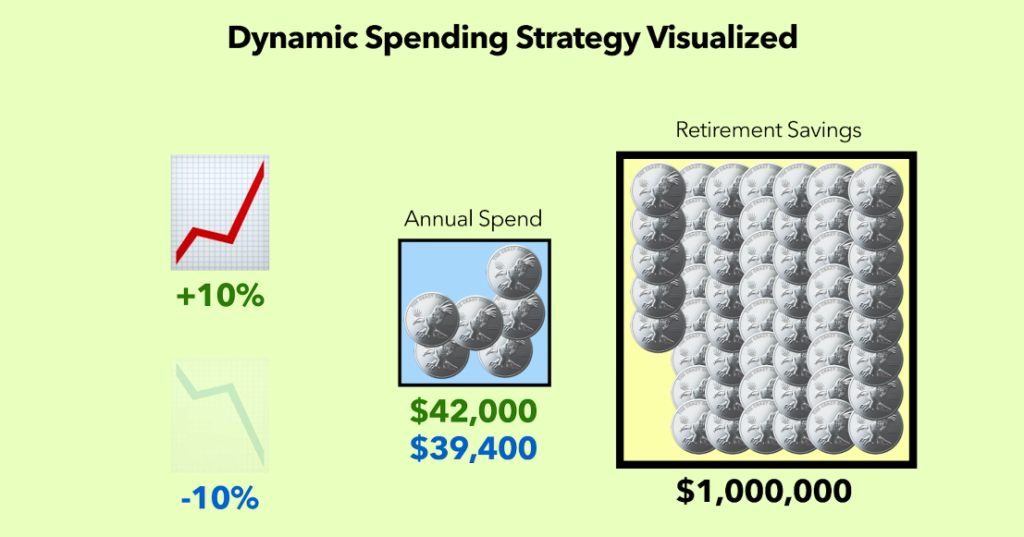
- In a good year (when your investments grow 10%), you can take out $42,000.
- In a not-so-good year (when your investments drop 10%), you might take out $39,400.
It’s a small change each year, but it can make a big difference over time.
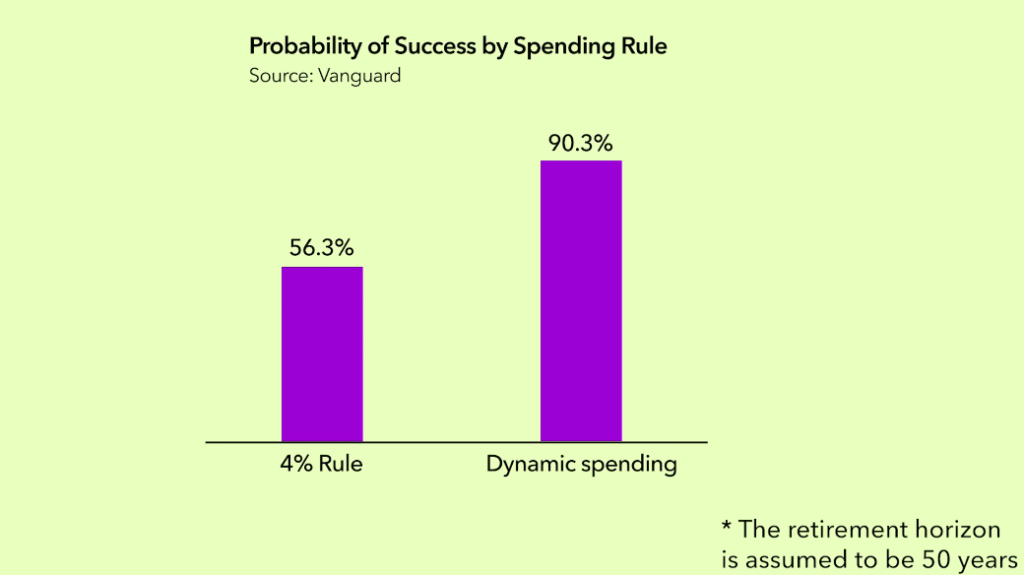
Studies show that this method could give you a 90% chance of your money lasting, compared to about 80% with the regular 4% rule.
The Big Picture: The dynamic spending strategy is all about being flexible. It helps you enjoy more money when times are good while protecting your savings when times are tough. It’s like having a budget that dances to the rhythm of the market!
The last thing I want to talk about In this blog,
How expenses change in retirement (a cushion for today)
When we think about retirement, we often worry about having enough money. But did you know that many people actually spend less money after they retire? Let’s look at how our spending usually changes when we stop working.
Food, Fun, and Getting Around: As we get older, we tend to spend less on things like:
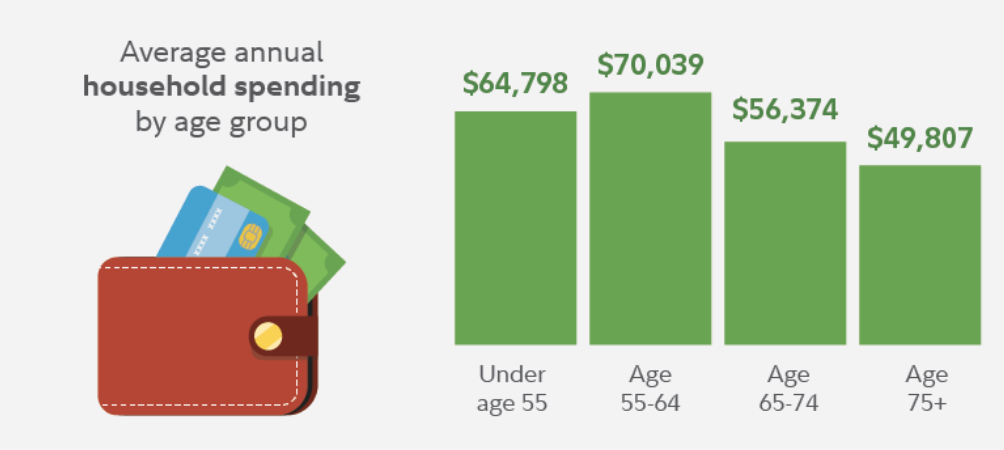
- Food (maybe we eat out less often)
- Entertainment (As we grow old we enjoy more free time instead of any entertainment)
- Transportation (we’re not driving to work every day).
Home Sweet Home: Our housing costs often go down too. Why?
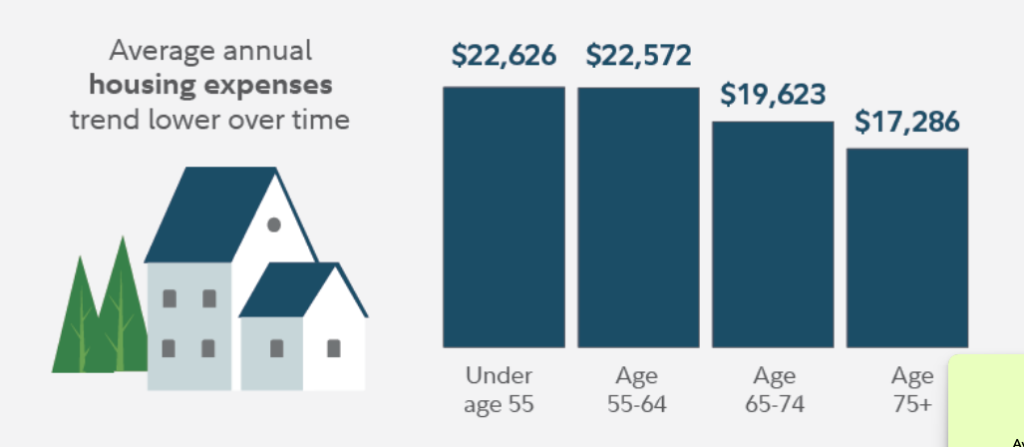
- Many finish paying off their house (no more mortgage!)
- Some people move to a smaller house (this is called downsizing)
In retirement, most people only pay for home insurance and taxes. That’s much less than a big mortgage payment!
The Health Factor
There is one thing that costs more as we age: healthcare. Our bodies need more care as we get older. It’s just part of being human.
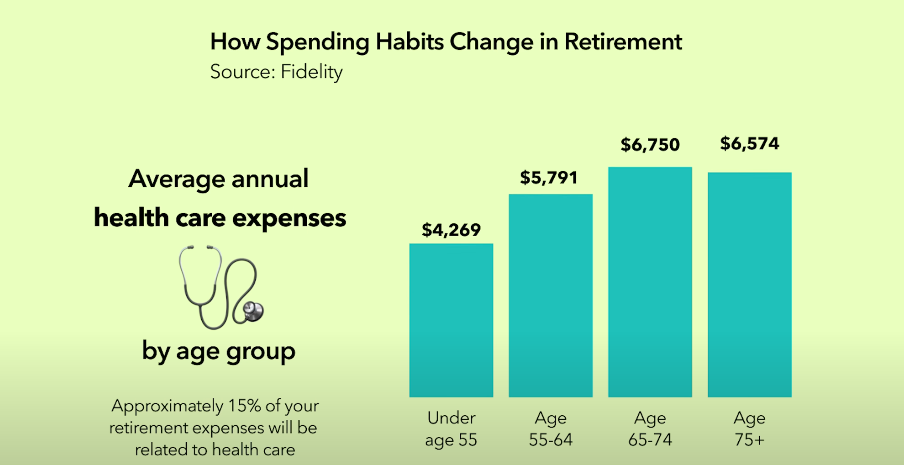
According to the fidelity report, You might spend about 15% of your retirement money on healthcare. That’s a big chunk, so Summing up on these 3 factors of spending it’s important to also consider these alongside the saving maths that we were doing before.
Think Deeper for Personalized Retirement Budget:
So, how much will YOU spend in retirement? That Completely depends on you! The above study from fidelity is the average of what a retiree’s Spending looks like, For a more personalized answer consider these things:
- Where you want to live
- What you want to do for fun
- How healthy you are
Once you have an idea of your retirement lifestyle (at least a small vision of that living), you can make a better guess about how much money you’ll need each year. alongside the math we were doing before!
The Big Takeaway: Retirement spending isn’t one-size-fits-all. Many costs go down, but some (like healthcare) go up. By understanding these changes, you can make a smart plan for your future. Life is full of surprises, and so is retirement!
Conclusion: Steps in Sequence
- Calculate your target retirement savings by multiplying your annual expenses by 25 (based on the 4% withdrawal rule).
- Determine your required savings rate using calculators like I did with calculator.net and networthify, factoring in your current savings, income, and expenses.
- Account for changing expenses in retirement, with some costs decreasing (e.g., transportation) and others increasing (e.g., healthcare). And your personal preferences as well at the end you will have a number that will be the retirement amount you will need!
- Now you can Either Consider lowering your planned withdrawal rate to 3% or even 2.5%. Which will increase the amount you need to retire.
- Or go With preferred Explore dynamic spending strategies that adjust your withdrawals based on market performance, potentially extending your portfolio’s longevity. if you’re aiming for a retirement lasting longer than 30 years.
- Don’t forget to Build a cash reserve for 1-2 years of expenses to avoid selling investments, during market downturns. If you choose to go with a dynamic spending strategy.
Please feel free to drop any suggestion or a question that you have and we will be responding to you shortly, until next time….


